


Prediction in sports has become increasingly popular, not only for entertainment but also due to its financial implications. The massive amount of data available for tournaments across football, basketball, rugby, and other sports is growing and becoming more accessible. This project presents a data mining case study using 10 years of historical WNBA (Women’s NBA) data covering players, teams, coaches, and game metrics to make predictions for a future test season (year 11), which corresponds to the real 2010 WNBA season.

A defining constraint is that predictions rely exclusively on information available at the start of the test season without access to any in-season game data. WNBA seasons operate in two distinct phases: teams first compete for win maximization in the regular season to qualify for the knockout playoffs. The primary objective was to forecast three distinct dimensions of the league’s outcomes: final regular season standings for both conferences, teams that will change head coaches, and recipients of individual performance awards.
On this page, I highlight some of the most interesting tasks and findings from the project; for full methodology and implementation details, see the complete report link at the end.
Data Understanding #
Our preliminary exploration revealed that the WNBA ecosystem is governed by rigid physical and performance-based hierarchies. We identified three distinct physical archetypes—Guards, Forwards, and Centers—with minimal overlap, suggesting that height and weight are primary determinants of on-court roles. Beyond physicality, we mapped a clear “class system” among franchises where only a select few “Dynasties” consistently convert playoff appearances into championship titles.
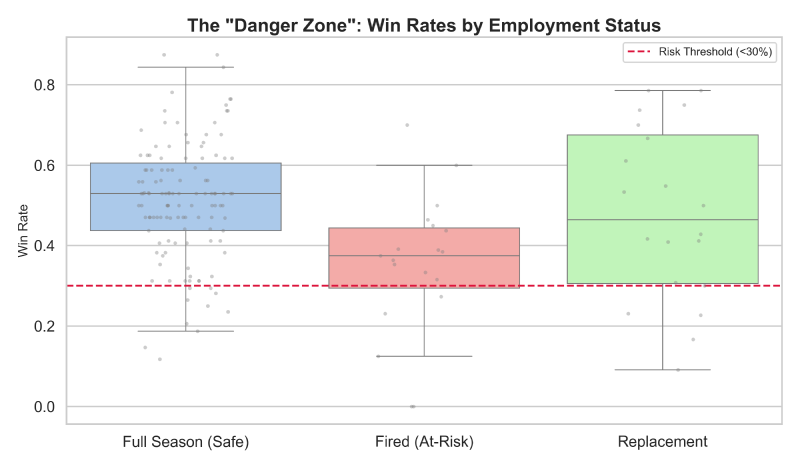
Perhaps most critical for our predictive modeling was the identification of the coaching “Danger Zone”. Our data showed a distinct performance cliff; coaches with win rates below 30% face an extreme risk of mid-season dismissal, while those exceeding 40% typically enjoy job security. Interestingly, veteran coaches with extensive playoff experience are statistically granted more leniency than rookies, indicating that tenure provides a “buffer” against short-term failure.
Regular-Season Ranking #
The core challenge of forecasting WNBA standings lies in the distinct competitive styles of the two conferences. To address this, we implemented a split-modeling strategy using the “Golden 5” historical indicators: Roster Continuity, Net Rebounding, Efficiency, Possession Control, and Leadership Stability.
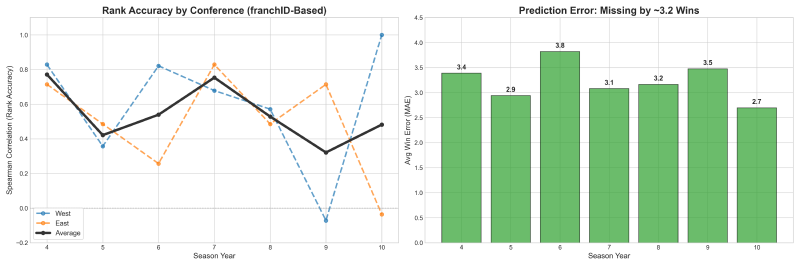
For the Western Conference, we utilized Ridge Regression to capture stable, linear trends, which previously yielded perfect ranking accuracy in Year 10. Our model correctly identified the Seattle Storm as the 2010 powerhouse, projecting them for the #1 seed based on high roster retention. In reality, the 2010 Storm delivered a historic 28-6 season, validating our model’s reliance on continuity. Conversely, the Eastern Conference required Gradient Boosting to navigate its inherent volatility and frequent “parity traps”. For Year 11, we forecasted the Indiana Fever to lead the East, banking on their established winning culture.
Coaching Changes #
Predicting head coach firings is a high-stakes ranking problem rather than a simple binary outcome. Our Support Vector Classifier (SVC) utilized an RBF Kernel to capture complex, non-linear interactions—such as the compounding pressure of a “Star Power” roster coupled with a sudden win-rate decline.
For the 2010 season, the SVC flagged Brian Agler (Seattle) and Marynell Meadors (Atlanta) as high-risk candidates due to intense underperformance pressure. This prediction serves as a fascinating outlier in hindsight; both coaches actually led their teams to the 2010 WNBA Finals. This suggests that the same “hot seat” metrics that signal risk can also identify environments where coaches are pushed to achieve elite, championship-level turnarounds.
Individual Awards #
Our individual award models leveraged specialized feature engineering, such as the “Former MVP” bias for voter psychology and “Per-36” efficiency stats to normalize playing time.
-
Most Valuable Player (MVP): Our Gradient Boosting model achieved a major victory by naming Lauren Jackson as the primary candidate with a 64.8% probability. Jackson indeed claimed the 2010 MVP, her third career win.
-
Defensive Player of the Year (DPOY): Using a Random Forest ensemble, we ranked Tamika Catchings as the #1 defensive threat. This was validated by her actual 2010 award, proving our “Defensive Contribution Share” metrics were highly accurate.
-
The Rookie of the Year (ROTY) Constraint: Our model faced a “cold start” problem due to zero historical WNBA data for new players. By simulating the draft [1] based on team need, we projected Felicia Chester as a top candidate. However, the 2010 winner was Tina Charles, whose sheer talent overcame the “opportunity” metrics our model used to simulate draft impact.
[1] (Real-World WNBA Draft): Teams pick rookies one-by-one in sequential rounds, e.g.: Pick #1 (Team A, Player X) → Pick #2 (Team B, Player Y) → Pick #3 (Team C, Player Z). Each rookie receives a unique overall draft position (1, 2, 3, …);
(Our Simplified Approach): We assign all rookies from a team the same draft priority based on team ranking, since we don’t have players statistics to rank them for pick order, e.g.: Team A (worst record) → All Team A rookies ranked higher than Team B rookies.
Conclusions #
This project demonstrated that successful data mining in professional sports is less about a magic formula and more about custom-fitting models to the unique logic of each task. The primary hurdle remains data scarcity; with limited historical examples, models are prone to overfitting, where they essentially memorize the past rather than learning generalizable patterns.
In the contemporary landscape, professional betting houses and casinos have moved far beyond the season-lagged CSV files utilized in this study. Modern predictive engines utilize high-frequency biometric data, real-time optical tracking of every player movement, and sentiment analysis of social media to gauge locker room stability. While we successfully identified the 2010 MVP and Western Conference leader using “small data”, modern firms operate with a “total information” approach, running millions of Monte Carlo simulations to price risk in seconds.
More details about the process and implementation, see the complete report.